The Toolbox for Principal Software Engineers
When you hit the Principal level, your job shifts.
It's less about how you code — and more about how everyone else codes better because of you.
In my current role, I spend my days helping more than five product teams — each serving different healthcare and consumer-facing brands — move faster and cleaner without stepping on each other's toes.
That means aligning engineers, designers, and stakeholders across multiple platforms, products, and priorities, while keeping architecture consistent and maintainable.
Being a Principal also means keeping one eye on compliance — GDPR, HIPAA, California Consumer Privacy Act (CCPA), and other state-level Consumer Privacy laws, along with Accessibility (WCAG) and internationalization (i18n), aren't afterthoughts; they're part of the design constraints we work within.
Good architecture isn't just scalable — it's defensible when someone asks, "Are we compliant, accessible, and ready to go nationwide?"
Over time, I've built a "toolbox" that helps me stay grounded — full of stuff like vendor comparison sheets, diagraming habits, decision records, and dashboards that tell real stories.
This post is a tour of that toolbox — what's inside, and why I keep it there.
Vendor Comparison Matrix
Picking vendors is like dating: shiny demos don't mean long-term compatibility.
When you're responsible for architecture across multiple brands, you need to think beyond "does it work?" and ask things like:
Will this still make sense two years from now? Will it blow up our budget or lock us in? Does it actually meet our compliance and accessibility needs across all states?
Vendor selection isn't just about technical fit — it's also about regulatory and operational alignment.
I evaluate tools with a consistent lens that includes GDPR, HIPAA, California Consumer Privacy Act (CCPA), Accessibility (WCAG), and i18n readiness.
This helps ensure every product, regardless of brand, can scale safely and meet compliance requirements without patchwork fixes later.
Here's a taste of how I keep score:
| Category | Vendors | What I Look At |
|---|---|---|
| Address Autocomplete | Google Places API, Experian, SmartyStreet | Accuracy, rate limits, price per lookup, compliance with CCPA and state data regulations, accessibility, and regional coverage |
| Session Replay | LogRocket, Sentry, DataDog, FullStory | Replay clarity, PII masking, HIPAA compliance, integration with error logs, cost scaling |
| Real User Monitoring (RUM) | Grafana Faro, Sentry, DataDog | Page performance metrics, user session correlation, front-end visibility, data privacy, integration with existing telemetry |
| Headless CMS | Contentful, Strapi, Webflow, Netlify CMS | Editorial UX, theming flexibility, GraphQL API, GDPR and state-level data compliance, localization support |
| Platform Host | Vercel, GKE | Deployment simplicity, cost of scale, observability, data residency, vendor lock-in |
The goal isn't to crown a winner — it's to make tradeoffs visible.
When the next project asks, "why didn't we pick X?", the reasoning is already documented — and aligned with both engineering and compliance expectations.
Some of these tools, like Grafana Faro, Sentry, and DataDog, later show up again in the observability stack — tying front-end RUM insights to backend traces and logs.
That consistency matters: it keeps performance, reliability, and user experience aligned under the same monitoring umbrella. I go deeper into how this observability stack works end-to-end in a multi-brand healthcare platform in Share Packages, Not Applications, including the hard lessons from a Pub/Sub dead letter queue incident.
From Discovery to Adoption: Bringing a New Vendor into the Stack
Once a potential vendor looks promising, I like to follow a simple, repeatable path to evaluate and adopt it.
This helps balance curiosity with discipline — we stay open to innovation without getting lost in endless trials.
1. Initial Discovery
Start by setting up a comprehensive demo with the vendor's solution engineers.
This isn't just a sales pitch — it's a chance to dig into integration patterns, data handling,
observability hooks, and compliance posture.
Ask them to show how their tool would work within your real architecture, not just a generic
sandbox.
2. Proof of Concept (POC)
Run a two-week to one-month trial with a smaller, low-risk application — ideally one that mirrors a real use case.
Set clear success metrics (like latency reduction, visibility improvement, or workflow efficiency) and keep the communication tight — usually through direct Slack channels or email with the vendor's support engineers.
This is where most tools prove whether they actually fit your operational reality.
3. Adoption and Iteration
Once the POC delivers value, start gradually releasing it into production.
Instrument metrics early — usage, performance, user impact — and keep improving based on what you learn.
The goal isn't just adoption; it's to make the tool earn its place in the ecosystem by showing clear business or developer value over time.
This approach keeps experimentation lightweight but structured.
It helps teams build confidence in new tools while minimizing risk — and makes it easier to justify scaling the adoption when the results are measurable.
Once the right tools are in place, the next challenge is documenting how they fit together — and keeping that understanding shared across teams.
Diagramming and Documentation
Words are overrated when diagrams can do the job in half the time.
I live inside PlantUML, Mermaid, and sometimes Lucidchart, depending on who needs to read it.
When I'm untangling a gnarly system or pitching a new idea, I draw first and explain later.
A few go-tos that save my sanity:
- Use C4 model for architecture diagrams — it scales from high-level context to low-level code. Add the diagrams in a central repo so everyone can find them.
- Use Mermaid inside Markdown docs — it keeps diagrams close to code.
- Add ADRs (Architectural Decision Records) whenever we make a call that's hard to undo.
- Use the Diátaxis framework to separate tutorials, how-tos, explanations, and references — so people actually find what they need.
Every diagram or ADR is basically a breadcrumb trail for the next person.
Future-you will thank past-you.
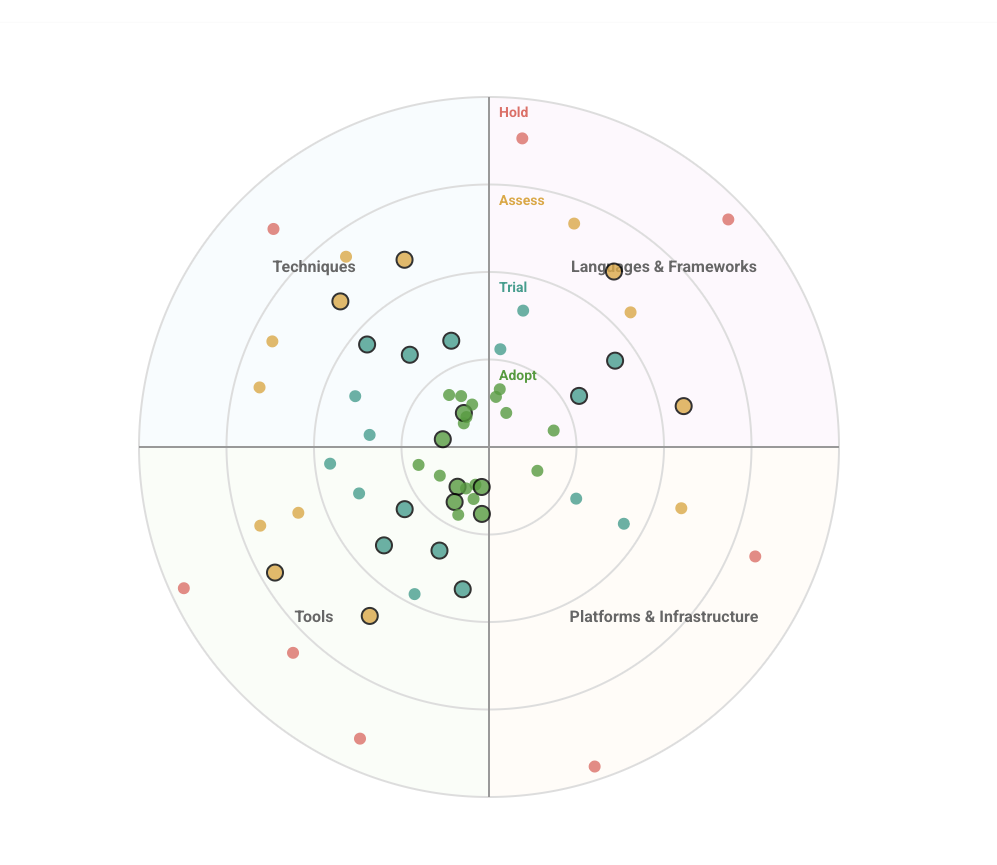
Technology Radar: A Lightweight Alignment Tool
When you've got more than a handful of teams, a Technology Radar keeps everyone on the same page
without writing a policy for everything.
It's a living map of what we Adopt, Trial, Assess, and Hold across key categories
(Techniques, Tools, Platforms, Languages & Frameworks).
How I run it
- Simple rings: Adopt, Trial, Assess, Hold.
- Quarterly refresh: small PRs, short writeups (2–4 sentences each).
- Not a mandate: a compass for sane defaults, not a hammer.
Here is an example technology radar for my personal use.
If you're evaluating a larger platform change rather than individual tools, my guide on why re-platforming matters covers the strategic thinking behind technology transformation timing.
Monitoring and Alerts
You can't improve what you can't see — and if you can't trust the numbers, you're flying blind.
The observability setup connects the dots between user behavior and system health.
RUM tools like Grafana Faro, Sentry,
and DataDog bridge the gap between what users experience in the
browser and what services report in logs and metrics.
I push hard for:
- JSON-formatted structured logs (stop logging strings — give me fields!)
- OpenTelemetry everywhere for unified tracing, metrics, and logs
- Grafana dashboards for long-term health
- Sentry dashboards for short-term user pain
Also: review your alerts quarterly.
If everyone's ignoring them, they're noise, not signals.
Observability isn't about catching failures — it's about learning from them.
Your logs should tell a story, not just complain.
The Real Toolbox: Frameworks for Thinking
All these tools — the vendors, the diagrams, the dashboards — are just surface level.
The real "toolbox" is how you think.
For me, that means:
- Data over opinions
- Strong opinions, loosely held
- Bias for clarity over correctness
- Document once, scale forever
Being a Principal Engineer is about building the systems that build systems.
You're not just coding anymore — you're designing the feedback loops, visibility layers, and decision frameworks that keep the machine moving.
Good engineering leadership isn't just about picking the right tool — it's about creating trust through transparency.
When every team can see the same metrics, the same architecture decisions, and the same tradeoffs, alignment happens naturally.
That's what I aim for: a shared rhythm across brands, tools, and teams — where everyone understands not just what we're building, but why we're building it that way.
Worth mentioning
I've also written about Leading without Authority which is a complementary skillset for Principal Engineers. It is also a nice Toolbox item to have.
This blog is written in a personal capacity and reflects my own perspective on the work; it is not affiliated with or endorsed by my employer. Some details are simplified, generalized, or anonymized, and figures describe the platform at the time of writing. All trademarks belong to their respective owners.